.png)
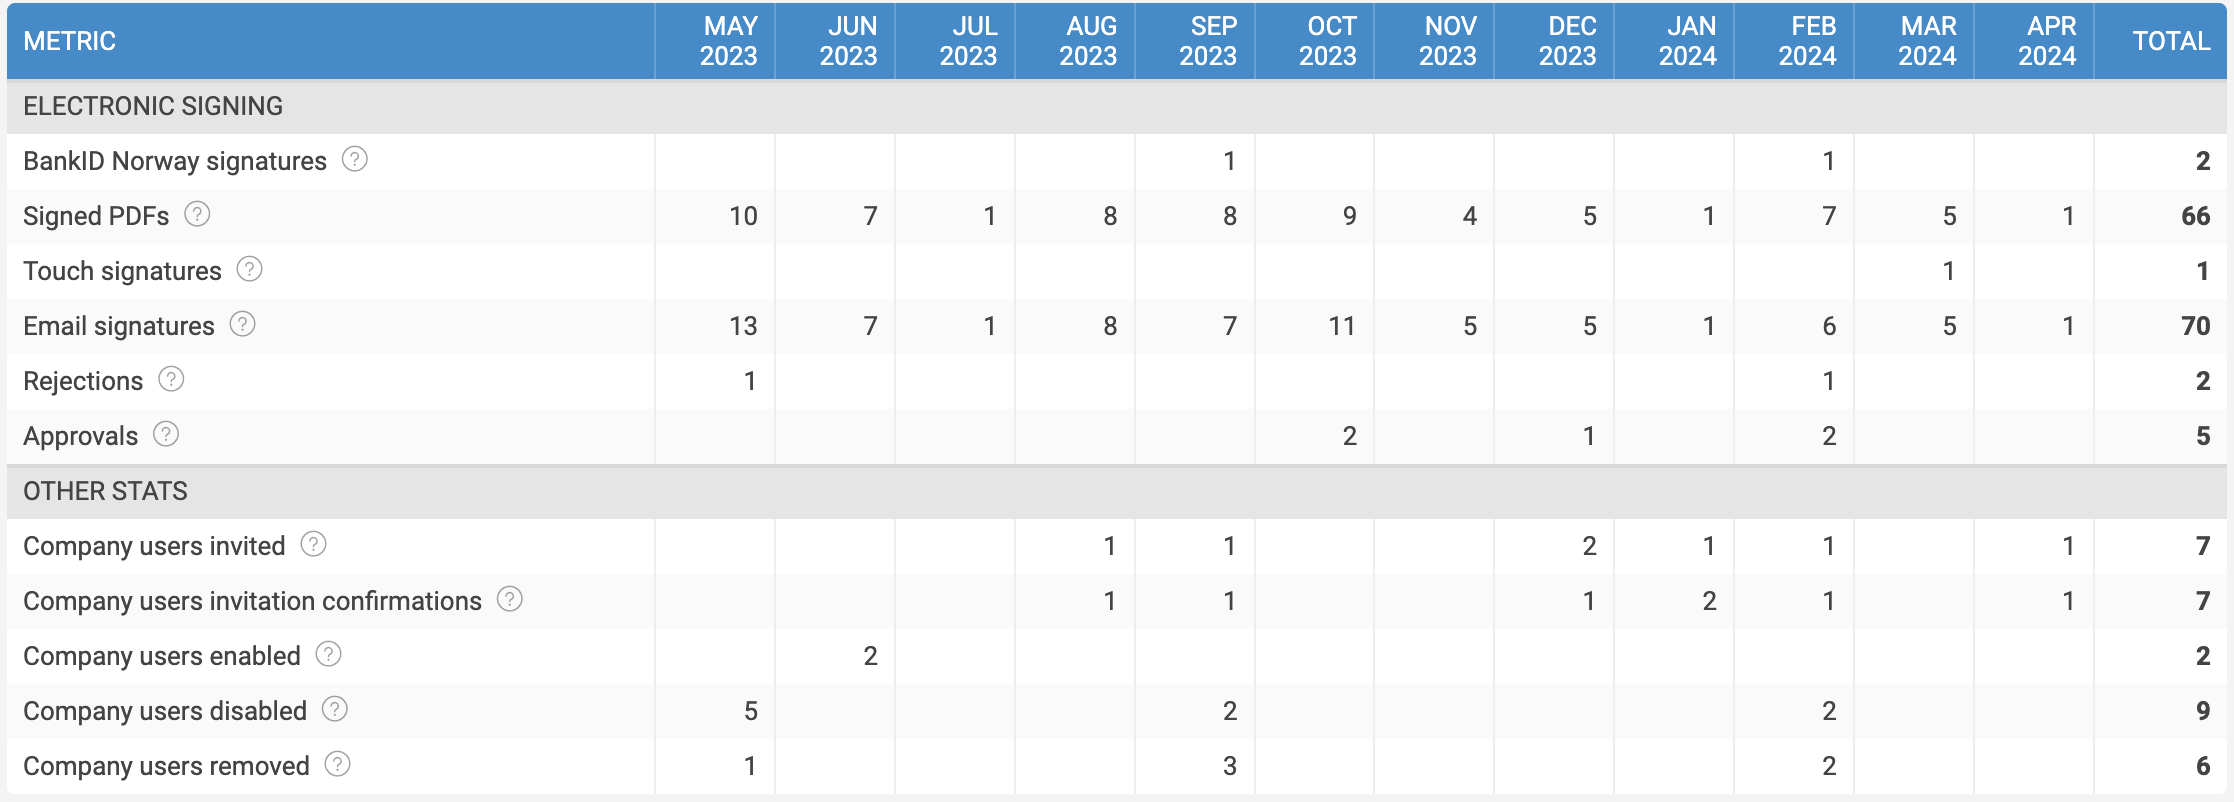
User-friendly usage statistics table
1. Is this relevant to me?
This feature is available for your company's admin users.
2. What is it?
A UX/UI update meant to make the information more structured, easier to digest and providing additional information for each usage item. The usage statistics provides insight into what resources a company is using under Verified flows, and can provide data that is useful for billing and usability analysis, or general research.
3. How does it work?
We are using the columns for the months, and the row for the data. This is a scalable layout and it will always fit nicely into view.
Also, since we have a considerable number of data points, we have tooltips to explain what each value means in simple terms. Now all the usage statistics metrics have a distinct, clear and concise label and tooltip detailing the metric further.